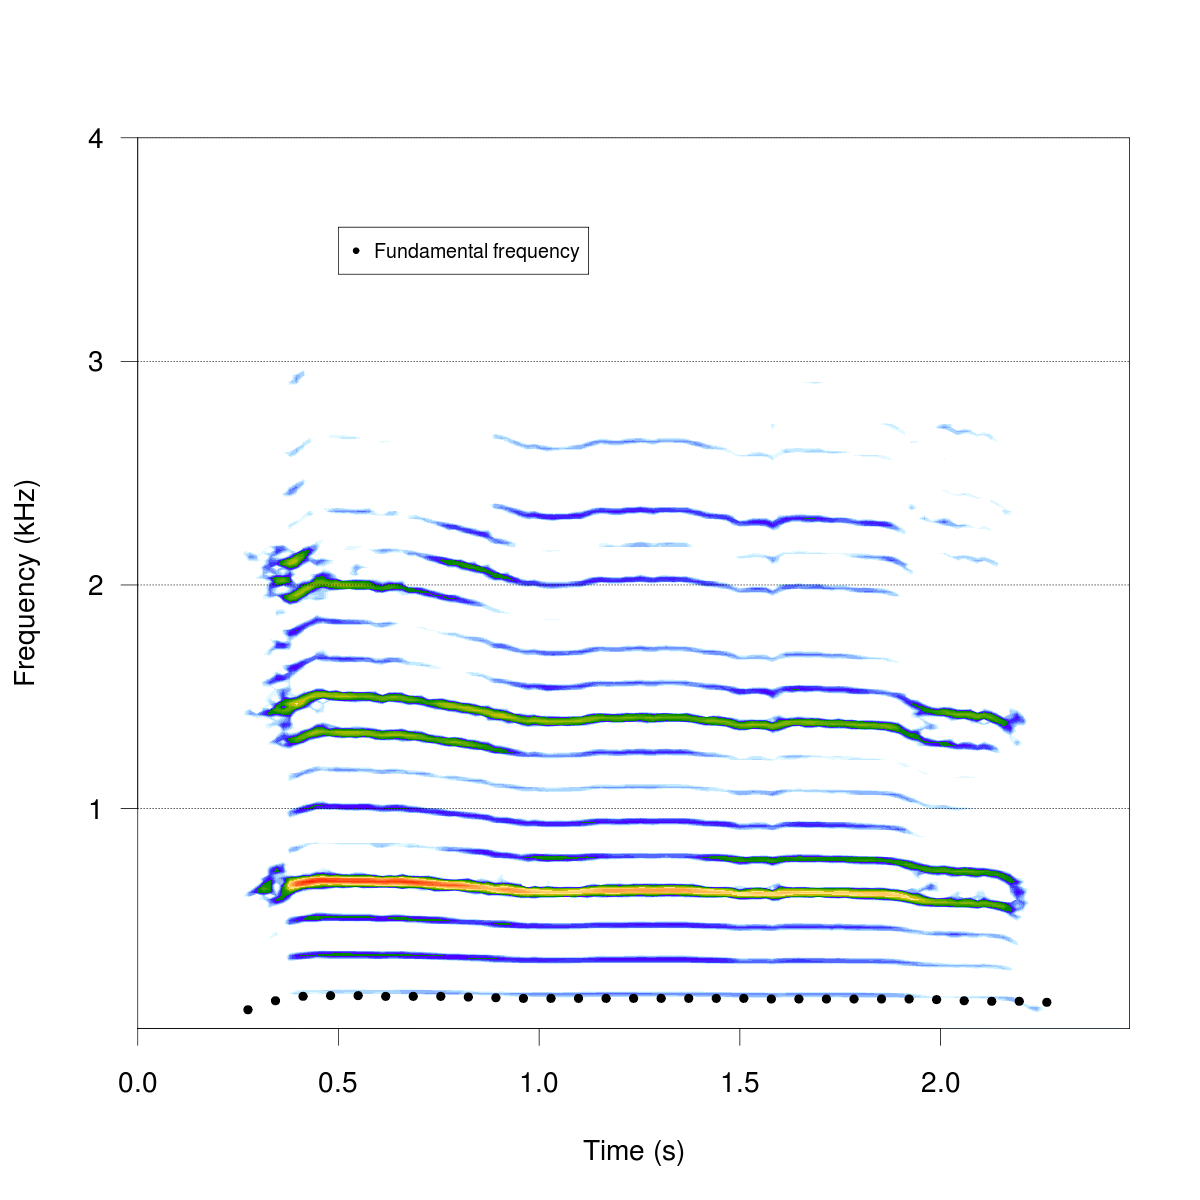
data(sheep)
spectro(sheep, ovlp=75, scale=FALSE)
res <- autoc(sheep, threshold=10, fmin=100, fmax=700, plot=FALSE)
points(res, pch=20)
legend(0.5,3.6, "Fundamental frequency", pch=20, col="black", bty=0, cex=0.7)