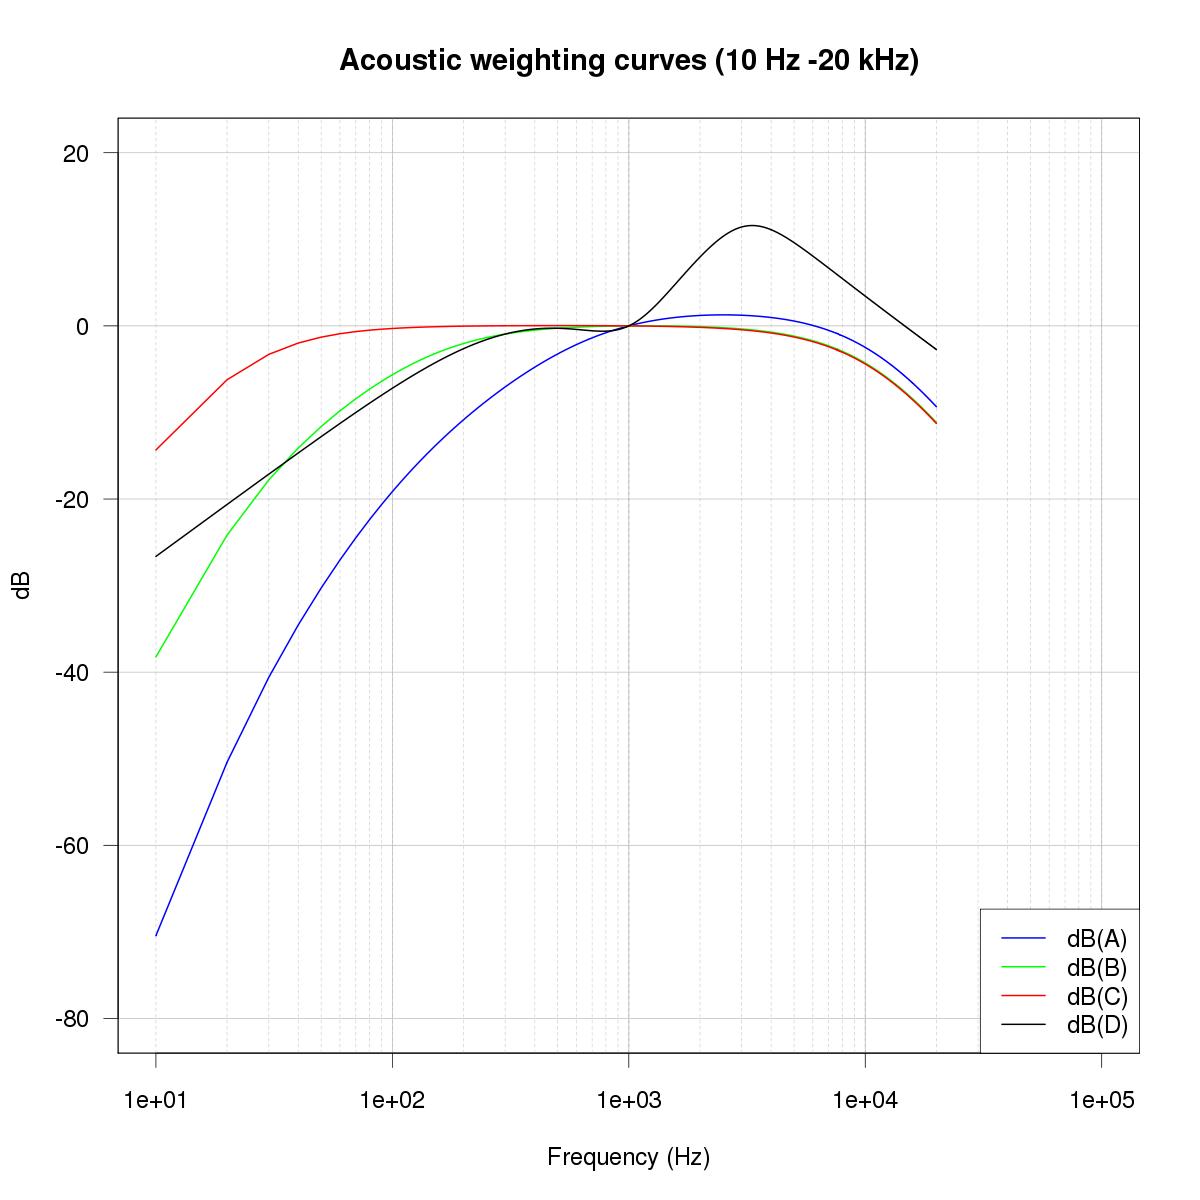
f <- seq(10,20000,by=10)
par(las=1)
plot(f, dBweight(f)$A, type="n", log="x",	xlim=c(10,10^5),ylim=c(-80,20),xlab="",ylab="",xaxt="n",yaxt="n")
abline(v=c(seq(10,100,by=10),seq(100,1000,by=100),seq(1000,10000,by=1000),seq(10000,100000,by=10000),c(100,1000,10000,100000)),col="lightgrey",lty=2)
abline(v=c(100,1000,10000,100000),col="grey")
abline(h=seq(-80, 20, 20),col="grey")
par(new=TRUE)
plot(f, dBweight(f)$A, type="l", log="x",	xlab="Frequency (Hz)", ylab="dB",lwd=2, col="blue", xlim=c(10,10^5),ylim=c(-80,20))
title(main="Acoustic weighting curves (10 Hz -20 kHz)")
lines(x=f, y=dBweight(f)$B, col="green",lwd=2)
lines(x=f, y=dBweight(f)$C, col="red",lwd=2)
lines(x=f, y=dBweight(f)$D, col="black",lwd=2)
legend("bottomright",legend=c("dB(A)","dB(B)","dB(C)","dB(D)"), lwd=2,col=c("blue","green","red","black"),bty="o",bg="white")