data(tico)
f <-tico@samp.rate
ticon <- tico@left/max(tico@left) + noisew(d = length(tico@left)/f, f)
spectro(ticon, f, palette = rev.gray.colors.2)
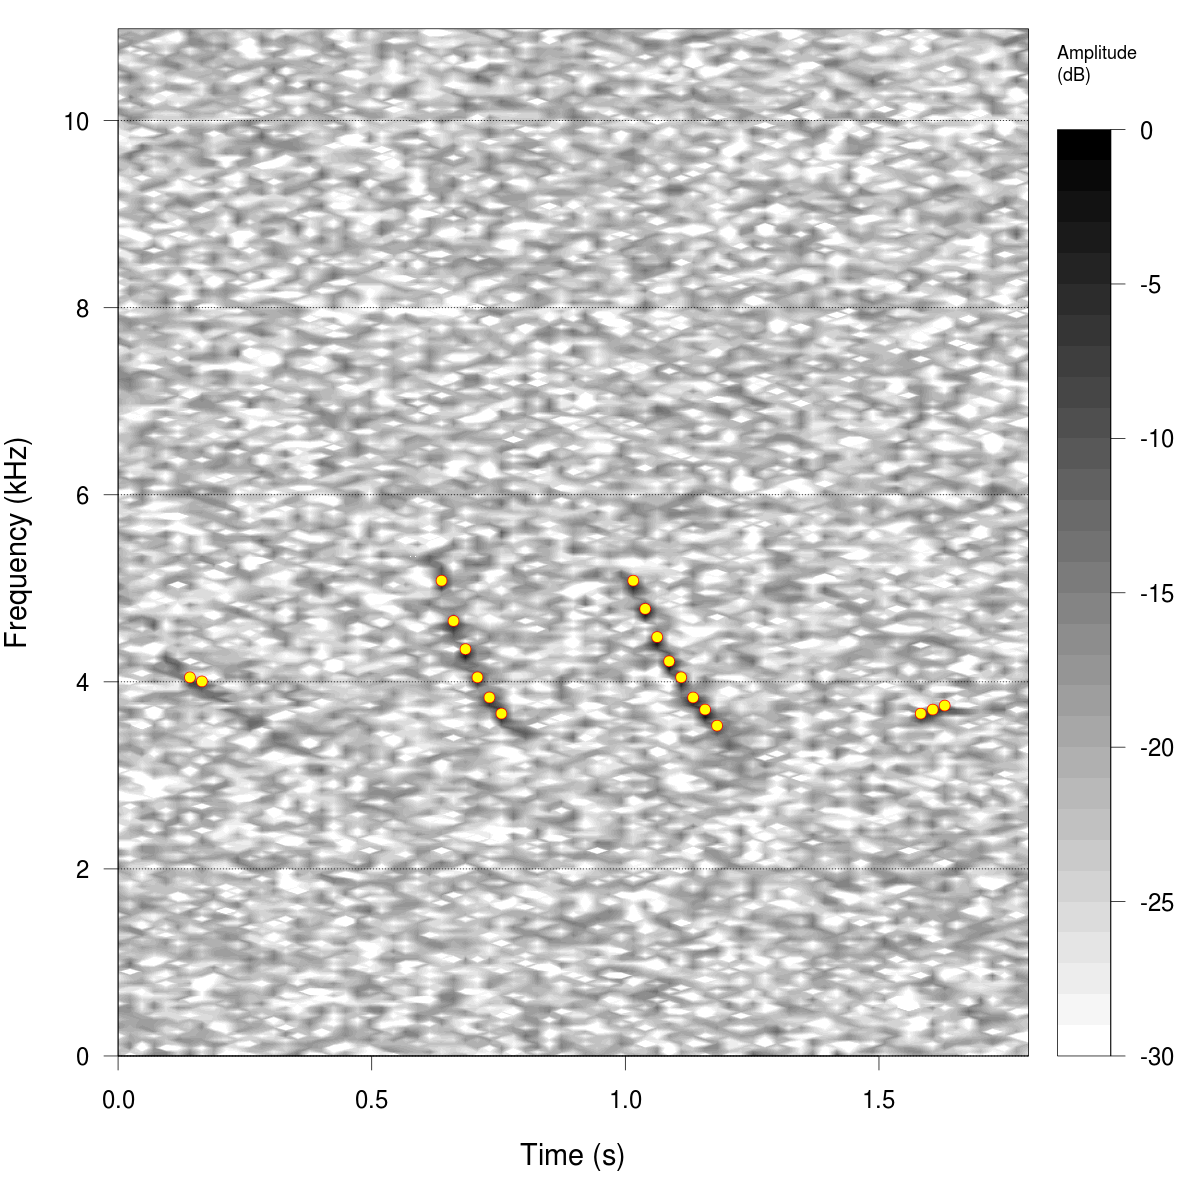
res <- dfreq(ticon, f, clip = 0.3, plot = FALSE)
spectro(ticon, f, palette = rev.gray.colors.2)
points(res, col = "red", bg = "yellow", pch = 21)