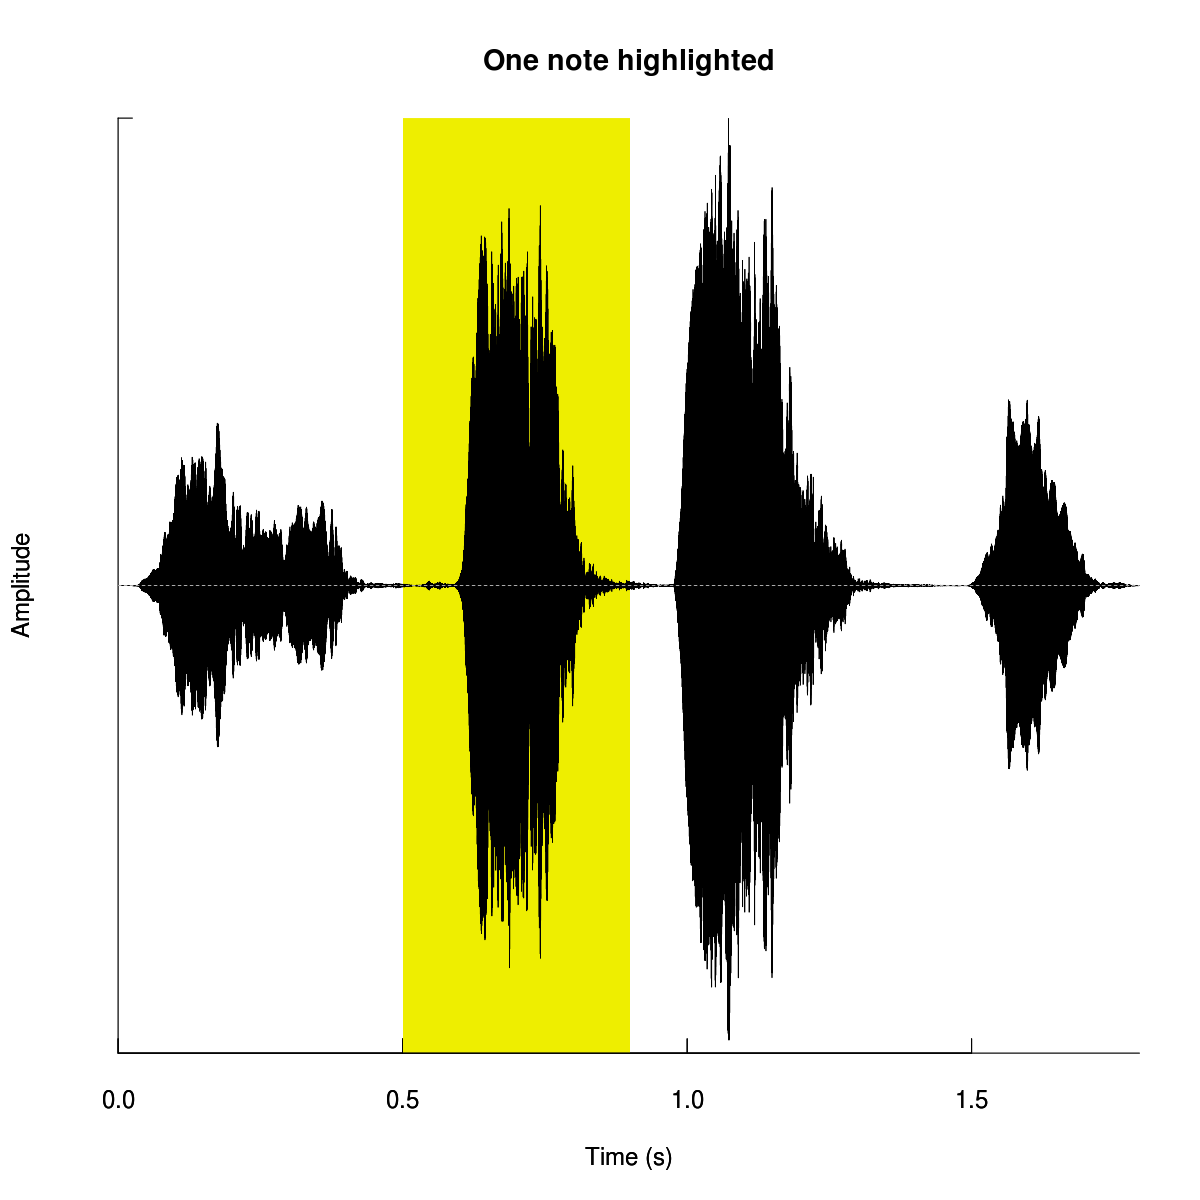
data(tico)
y <- max(abs(tico@left))
oscillo(tico, type="n")
polygon(x=c(0.5,0.9,0.9,0.5),  y=c(-y, -y, y, y), col="yellow2", border="NA")
par(new=TRUE)
oscillo(tico, title="One note highlighted")