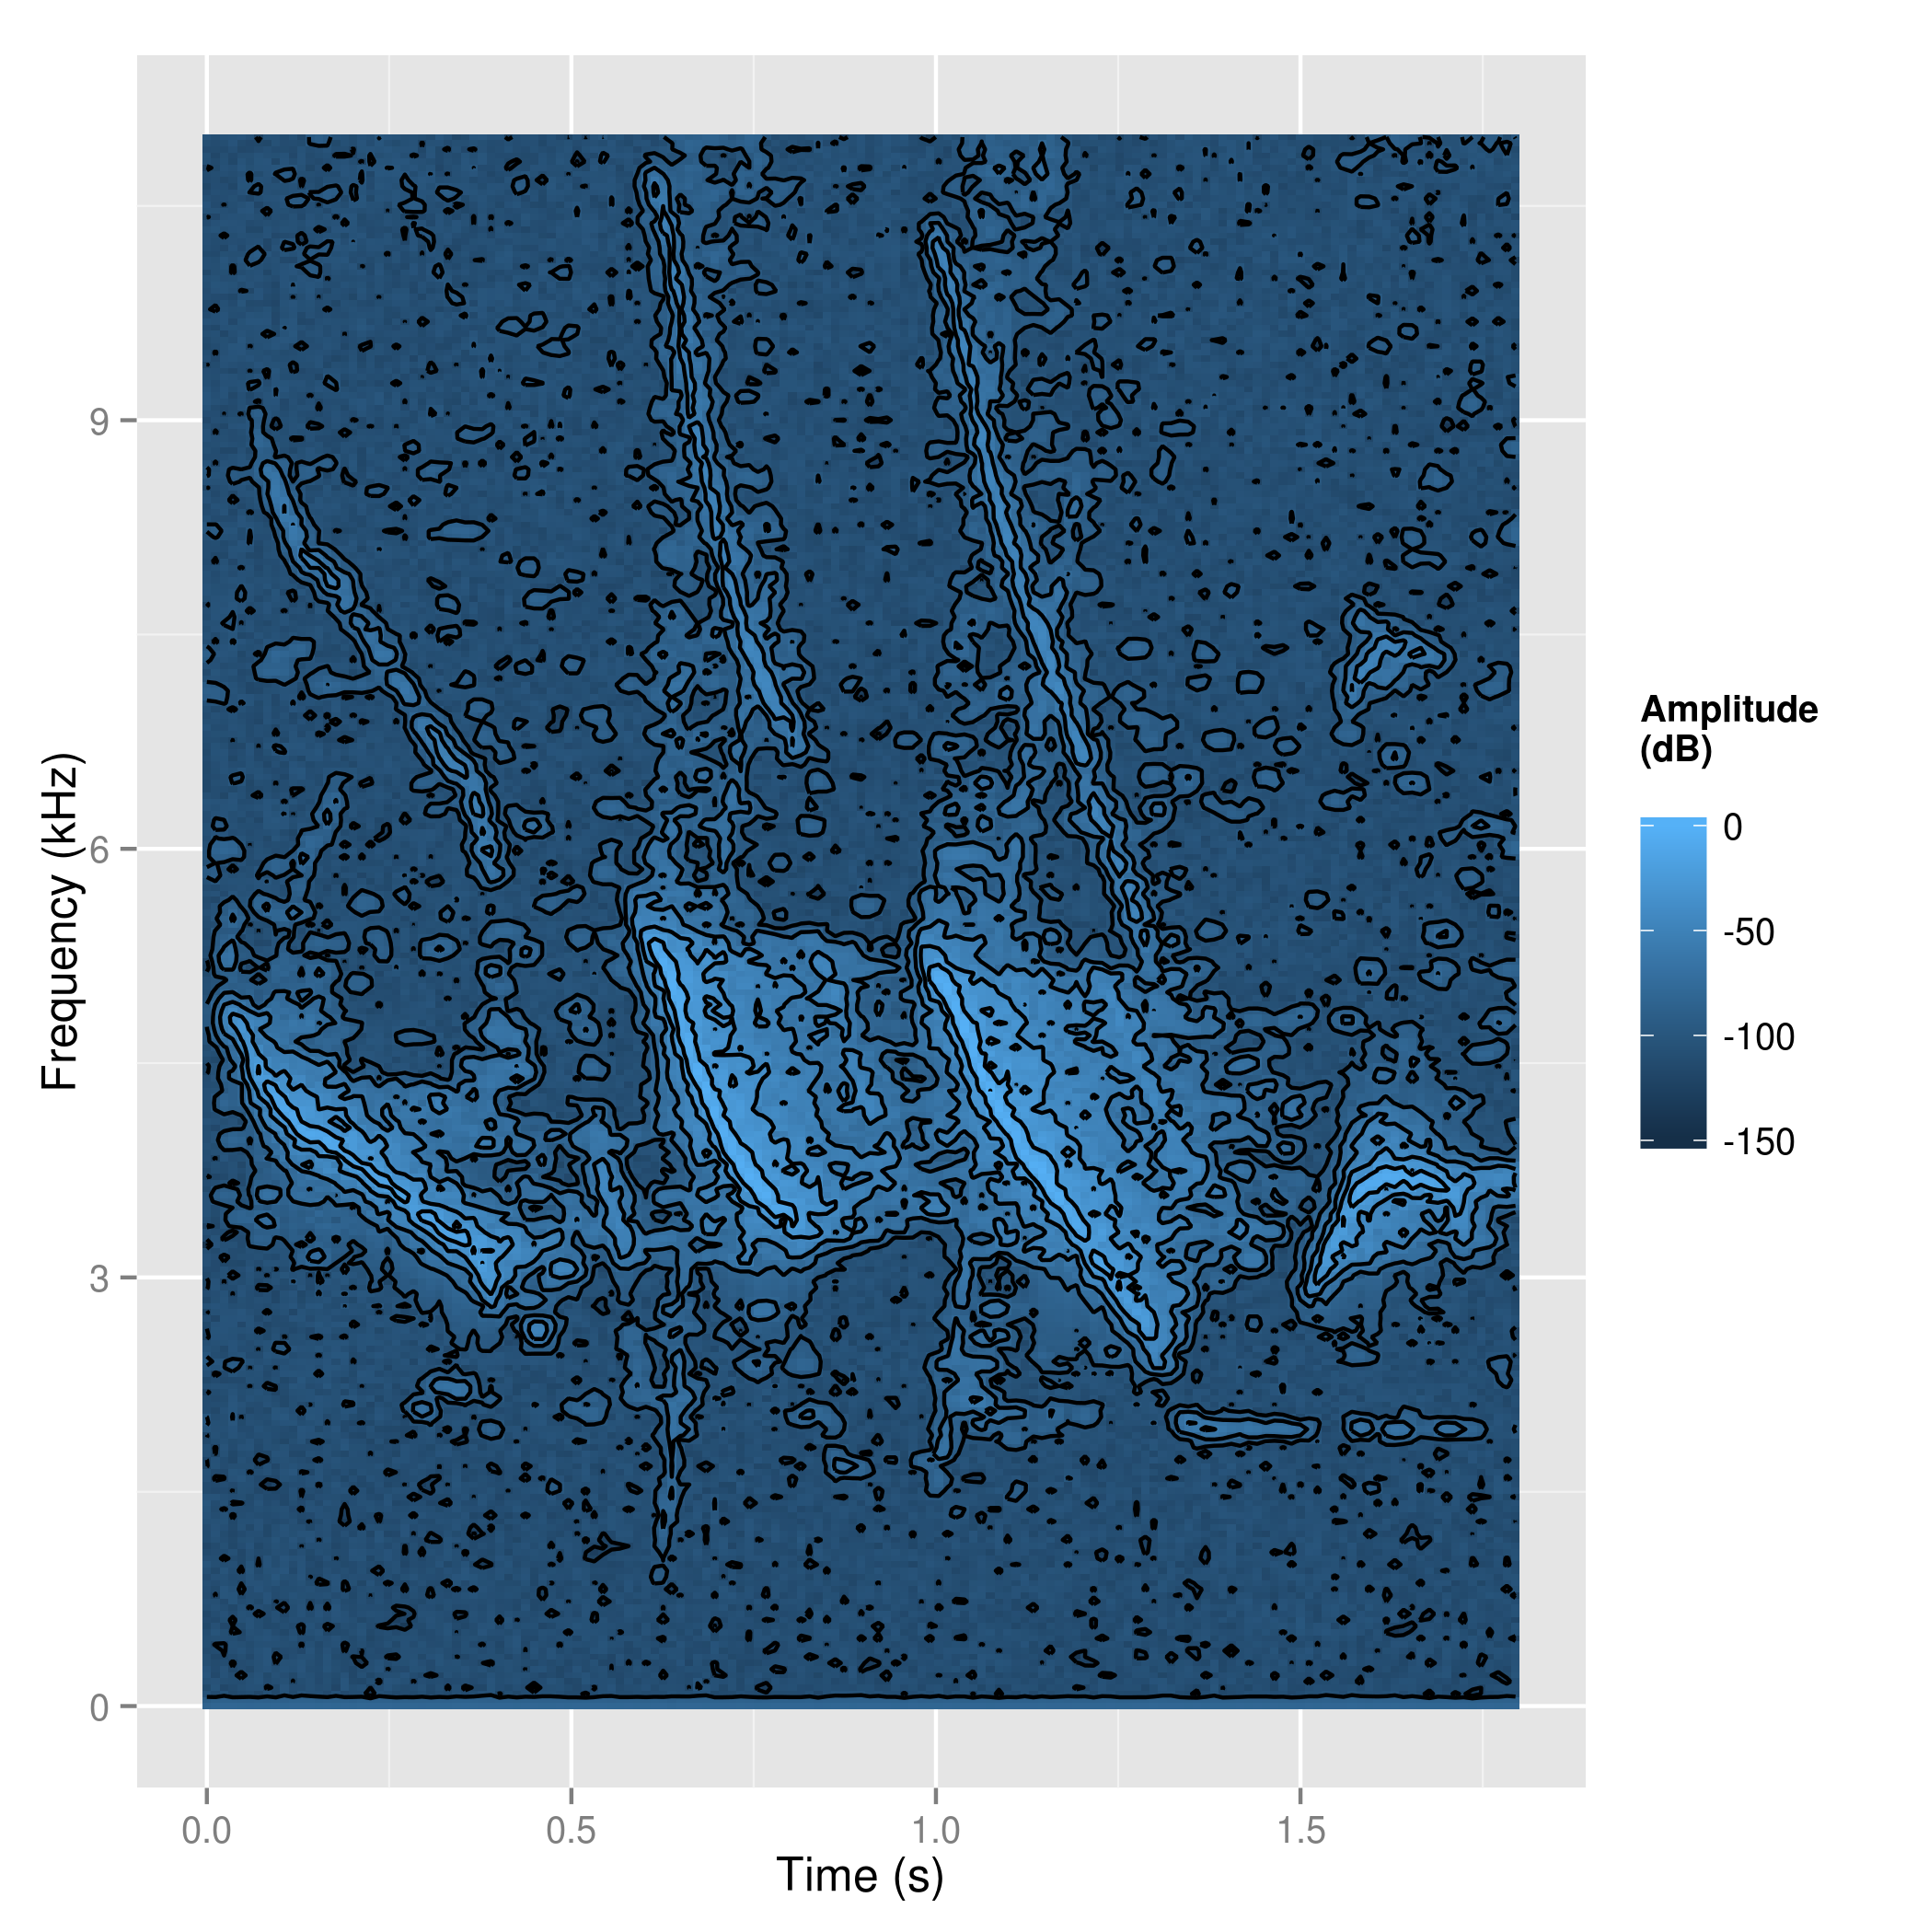
require(ggplot2)
data(tico)
v <- ggspectro(tico, ovlp=50)
v + geom_tile(aes(fill = amplitude)) + stat_contour()