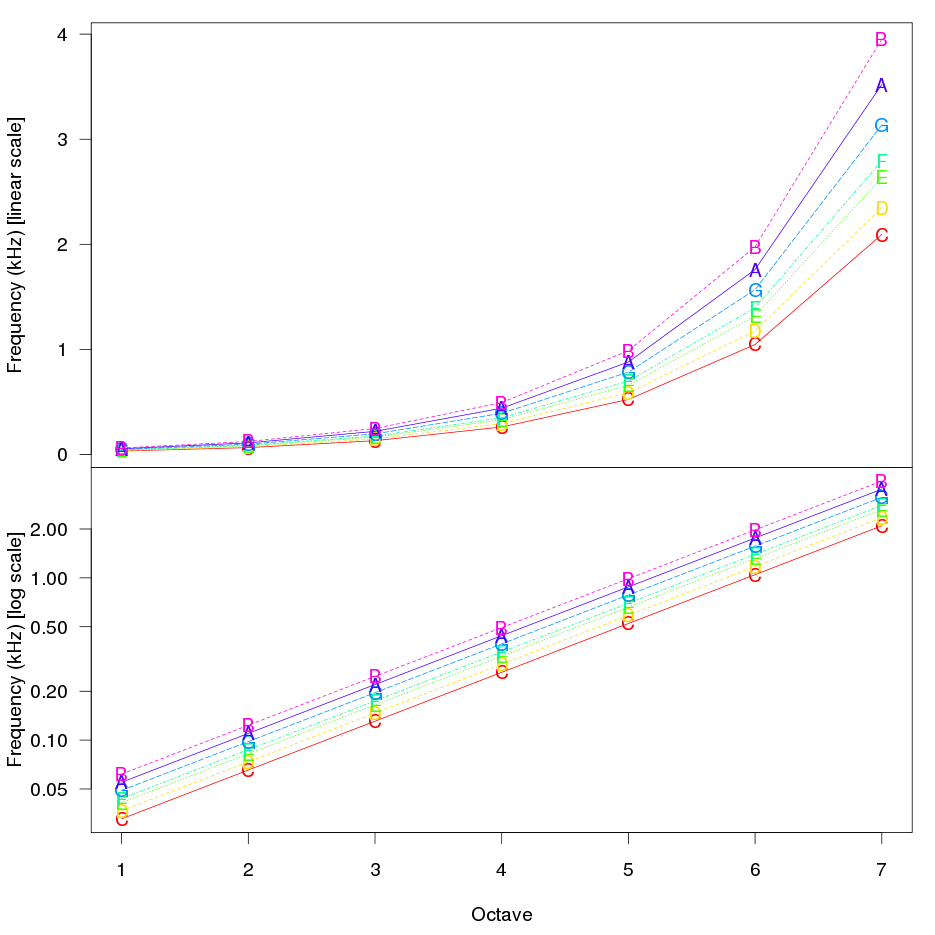
# Octave series of music notes following a linear and a logarithmic scale.
names <- c("C","D","E","F","G","A","B")
values <- c(261.63, 293.66, 329.64, 349.23, 392, 440, 493.88)
res <- sapply(values, FUN=octaves)/1000
par(las=1, mfrow=c(2,1), mar=c(0,4,1,1))
matplot(x=1:7, y=res, t="o", pch=names, xlab="", ylab="Frequency (kHz) [linear scale]", col=rainbow(7), xaxt="n")
par(mar=c(4.5,4,0,1))
matplot(x=1:7, y=res, t="o", pch=names, xlab="Octave", ylab="Frequency (kHz) [log scale]", col=rainbow(7), ylog=TRUE, log="y")