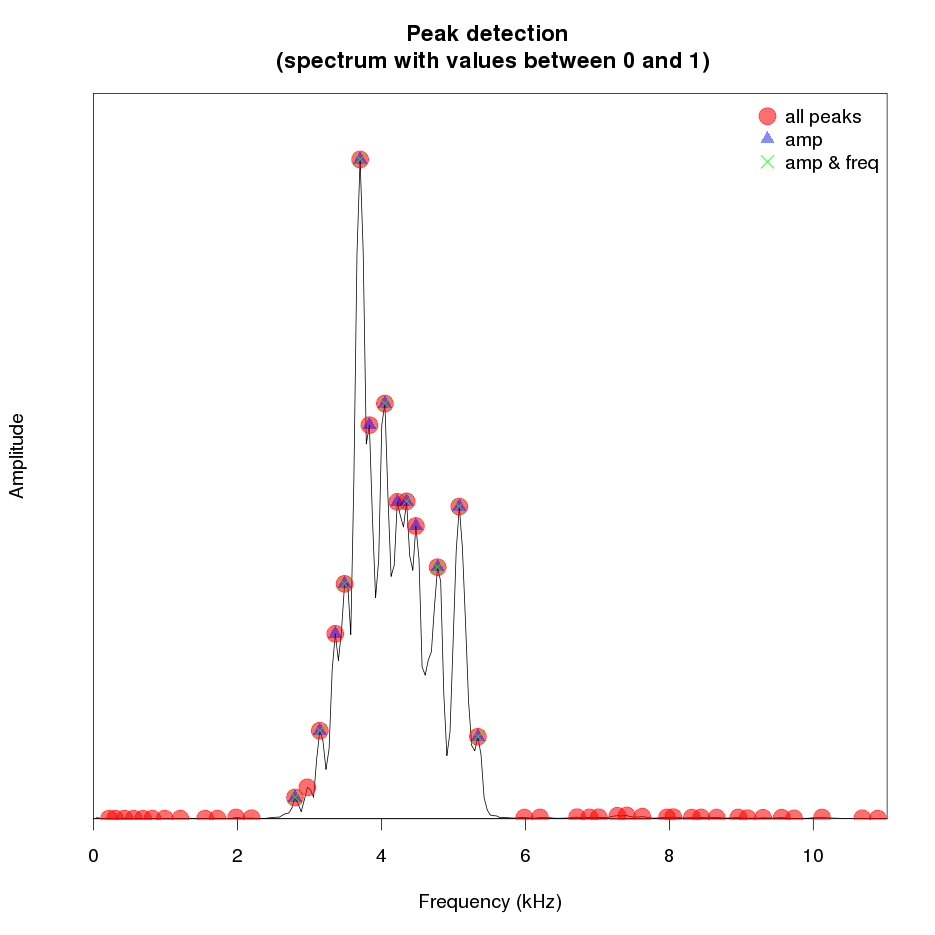
# frequency peaks detection
# a demonstration of the use of the different parameters of localpeaks()
data(tico)
meanspec(tico, f=22050)
col <- c("#ff000090","#0000ff75","#00ff00")
cex <- c(2,1.25,1.5)
pch <- c(19,17,4)
title(main="Peak detection \n (spectrum with values between 0 and 1)")
res1 <- fpeaks(spec, plot = FALSE)
res2 <- fpeaks(spec, amp=c(0.02,0.02), plot =FALSE)
res3 <- fpeaks(spec, amp=c(0.02,0.02), freq=200, plot = FALSE)
points(res1, pch=pch[1], col=col[1], cex=cex[1])
points(res2, pch=pch[2], col=col[2], cex=cex[2])
points(res3, pch=pch[3], col=col[3], cex=cex[3])
legend("topright", legend=c("all peaks","amp", "amp & freq"), pch=pch, pt.cex=cex, col=col, bty="n")