with full colour modifications
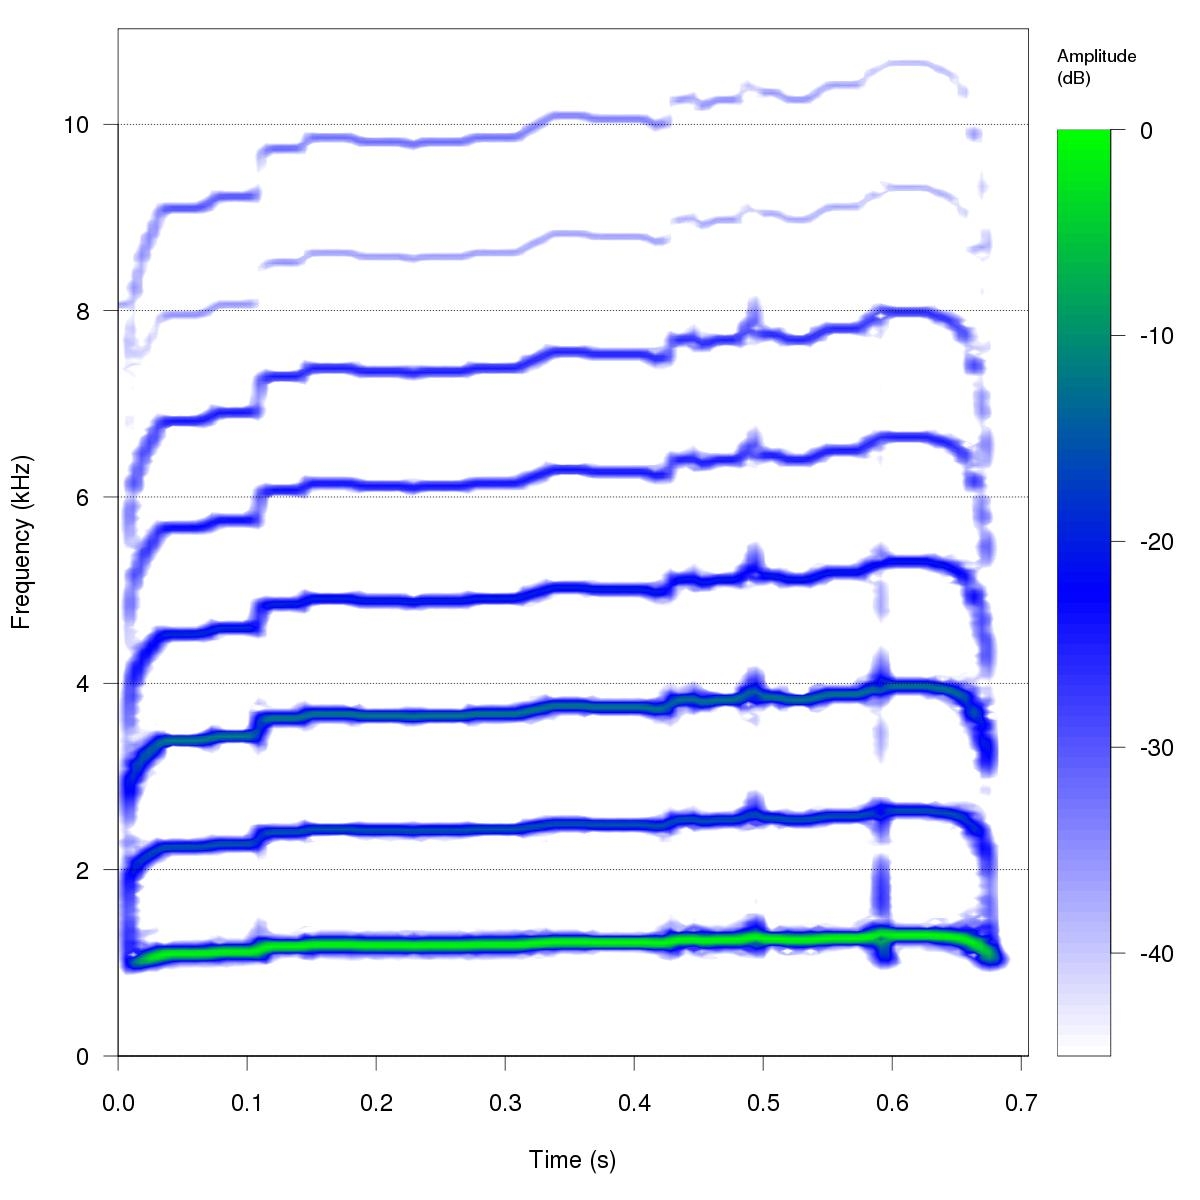
overlaid on spectrogram
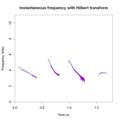
(Hilbert transform)
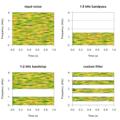
(FIR)
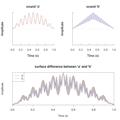
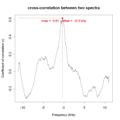
cross-correlation
in noisy conditions

NEW
NEW
NEW
NEW
NEW
NEW
|
|
|
|
|
|
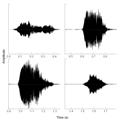
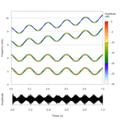
| Multi-frame oscillogram | Multi-frame oscillogram with full colour modifications |
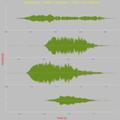
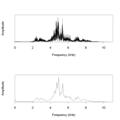
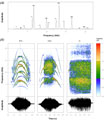
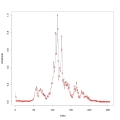
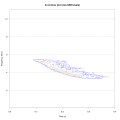
Envelope overlaid on oscillogram | Envelope and automatic temporal measurements | Spectral analyses | 2D-spectrogram |
|
|
|
|
|
|
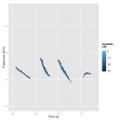
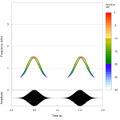
| Dominant frequency overlaid on spectrogram | 2D spectrogram and oscillogram with full colour modifications | Sound synthesis | Fundamental frequency overlaid on spectrogram |
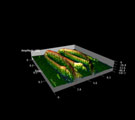
Multiframe output | 3D-spectrogram animated |
|
|
|
|
|
|
| Instantaneous frequency (Hilbert transform) |
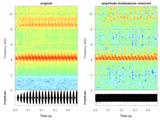
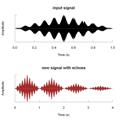
Removing amplitude modulations | Generation of echoes | Frequency filter (FIR) |
Envelope comparaison | Spectrum cross-correlation |
|
|
|
|
|
|
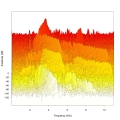
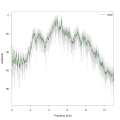
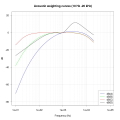
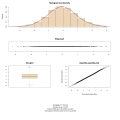
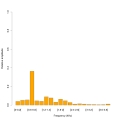
| Waterfall plot | Symbol analysis | Changing the color palette | Computing specific spectra | dB weightings | Quantitative data multi-plot |
|
|
|
|
|
|
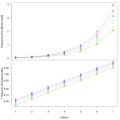
| Octave series |
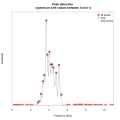
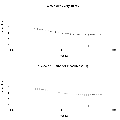
Peaks detection |
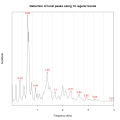
Local peak detection |
Animated frequency bands |
Contour spectrogram |
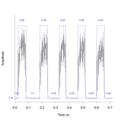
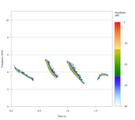
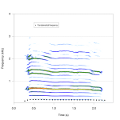
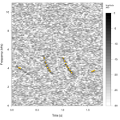
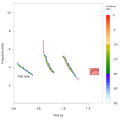
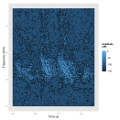
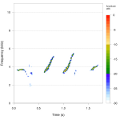
Dominant frequency track in noisy conditions |
|
|
|
|
|
|
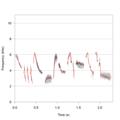
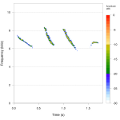
| Dominant frequency track |
Spectrogram annotation |
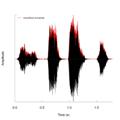
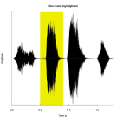
Oscillogram highlight |
Wide spectrogram |
Long spectrogram |
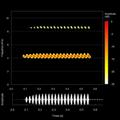
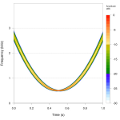
C major scale |
|
|
|
|
|
|
| ggplot2 spectrogram with contour NEW |
ggplot2 spectrogram other output NEW |
tonal synthesis: FM reversion NEW |
tonal synthesis: linear frequency shift NEW |
tonal synthesis: square function NEW |
tonal synthesis: Bell-like shape NEW |